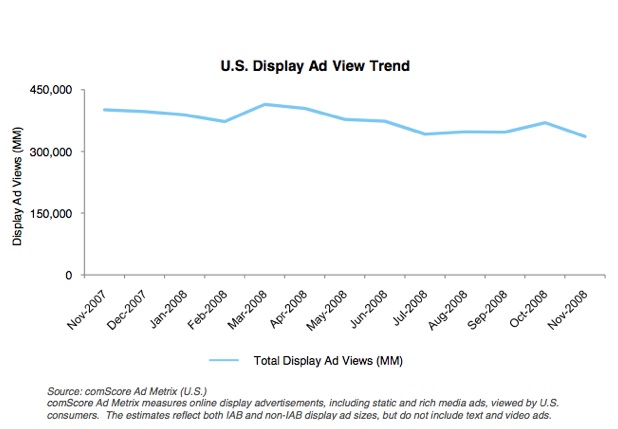
comScore estimates that 4.5 trillion ads were served to U.S. consumers last year. That comes to 2,000 ads per month per person.
Article Link
Glam Media has acquired AdaptiveAds ,
,
a startup based in Mumbai, India that serves display ads targetable by
the demographic characteristics brand advertisers understand (such as
“Women 24-40, Fashionista, Beauty”). It calls its contextual display
ads BrandWords. They will now be called Glam AdaptAds.
In addition to the ad targeting, AdaptiveAds brings a self-serve ad
server for ad agencies, as well as “brand engagement” tracking and
reporting tools.
When we say that semantic technology has a
whole lot of awesome potential, this is a fun example of what we're
talking about. If it can be done for restaurants, we expect similar
analysis of online sentiment can be sold for all kinds of different
real-world sectors.
The idea is that BooRah
tracks positive and negative reviews of food, service and ambiance at
restaurants across hundreds of online review sites. The service
monitors trends toward negative and positive reviews, pulls out key
quotes from users and offers other value adds based on its technology.
Now restaurant owners can subscribe to receive a PDF of their
monthly reports for an introductory price of $15 and a regular price of
$25 per month. (Here's a sample report, in PDF format.)
Simple charts and a straightforward presentation can offer
restaurant owners nervous about the Wild West of online opinion a
bird's eye view of what's really going on, month by month. On the down
side, the reports may enable those business owners to spot and track
down negative reviewers to hassle them for the injustices they've no
doubt done to a fine eatery.

17.1% of all clickthroughs on web advertising are the result of click fraud - the act of clicking on a web ad to artificially increase its click-through rate - according to the latest report from Click Forensics,
a company that specializes in monitoring and preventing internet crime.
The level of clickfraud is the highest the company has seen since it
started monitoring for it in 2006, dashing our hopes that it might hold steady in 2008. The company recorded a rate of 16.3% in Q1 2008.
Also alarming is the fact that over 30% of click fraud is now coming
from automated bots - a 14% increase from last quarter and the highest
rate Click Forensics has seen since it started collecting data. Click
fraud for ads on content networks like Google AdSense and Yahoo
Publisher Network was up to 28.2% from 27.1% last quarter, though that
figure has decreased since Q4 2007, when it was at 28.3%. Outside of
the US, Click Forensics reports that the most click fraud came from
Canada (which contributed 7.4%), Germany (3%), and China (2.3%).
Click Forensics also notes that it has seen a reemergence with some
old-hat tricks, like link farms. The company speculates that the
increase may be tied to the poor economy, which has spurred a rise in
activity like phishing and other cybercrime.